Welcome to GEPREP
This website presents a comprehensive compilation of published gene expression profiles in exercise responses in multiple species and organs with reliable annotations and user-friendly browsing, searching and visualization interfaces. Six groups were identified as acute aerobic exercise, acute resistance exercise, long-term aerobic training, long-term resistance training, other exercise forms and inactivity.
This section summarizes and explains how to use GEPREP and the problems you may have.
-
How to use this website?
GEPREP uses official genetic symbols. To better understand the website, we suggest you to read our published paper first. Then, the “Application” sections there may be useful.
-
What’s the options mean?
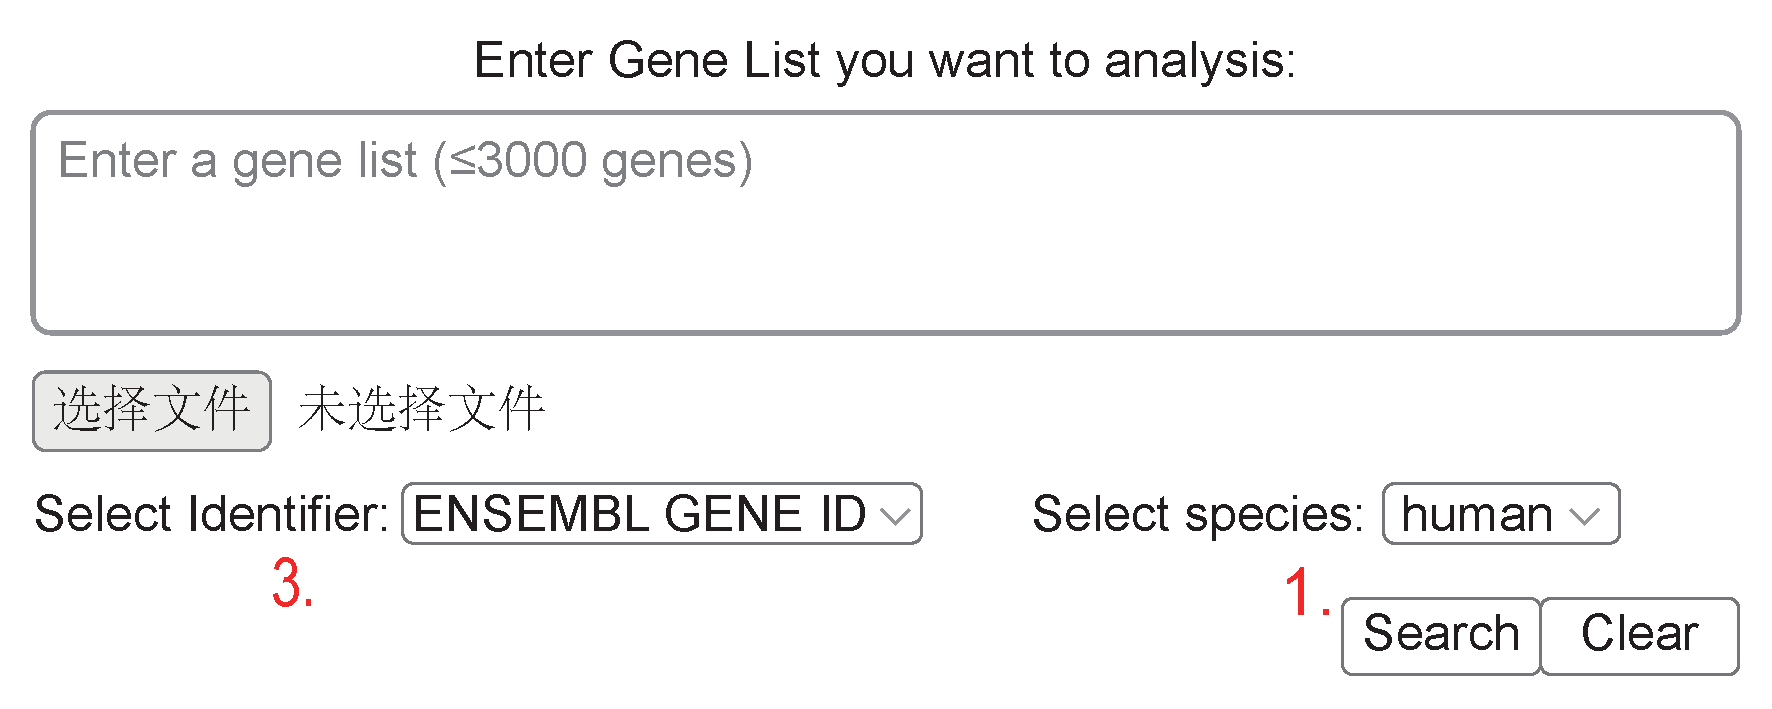
- searching the genes
- searching the samples
- the format of gene ids; for example, in ENSG00000150907 and FOXO1, the former is ENSEMBL GENE ID, and the latter is GENE NAME
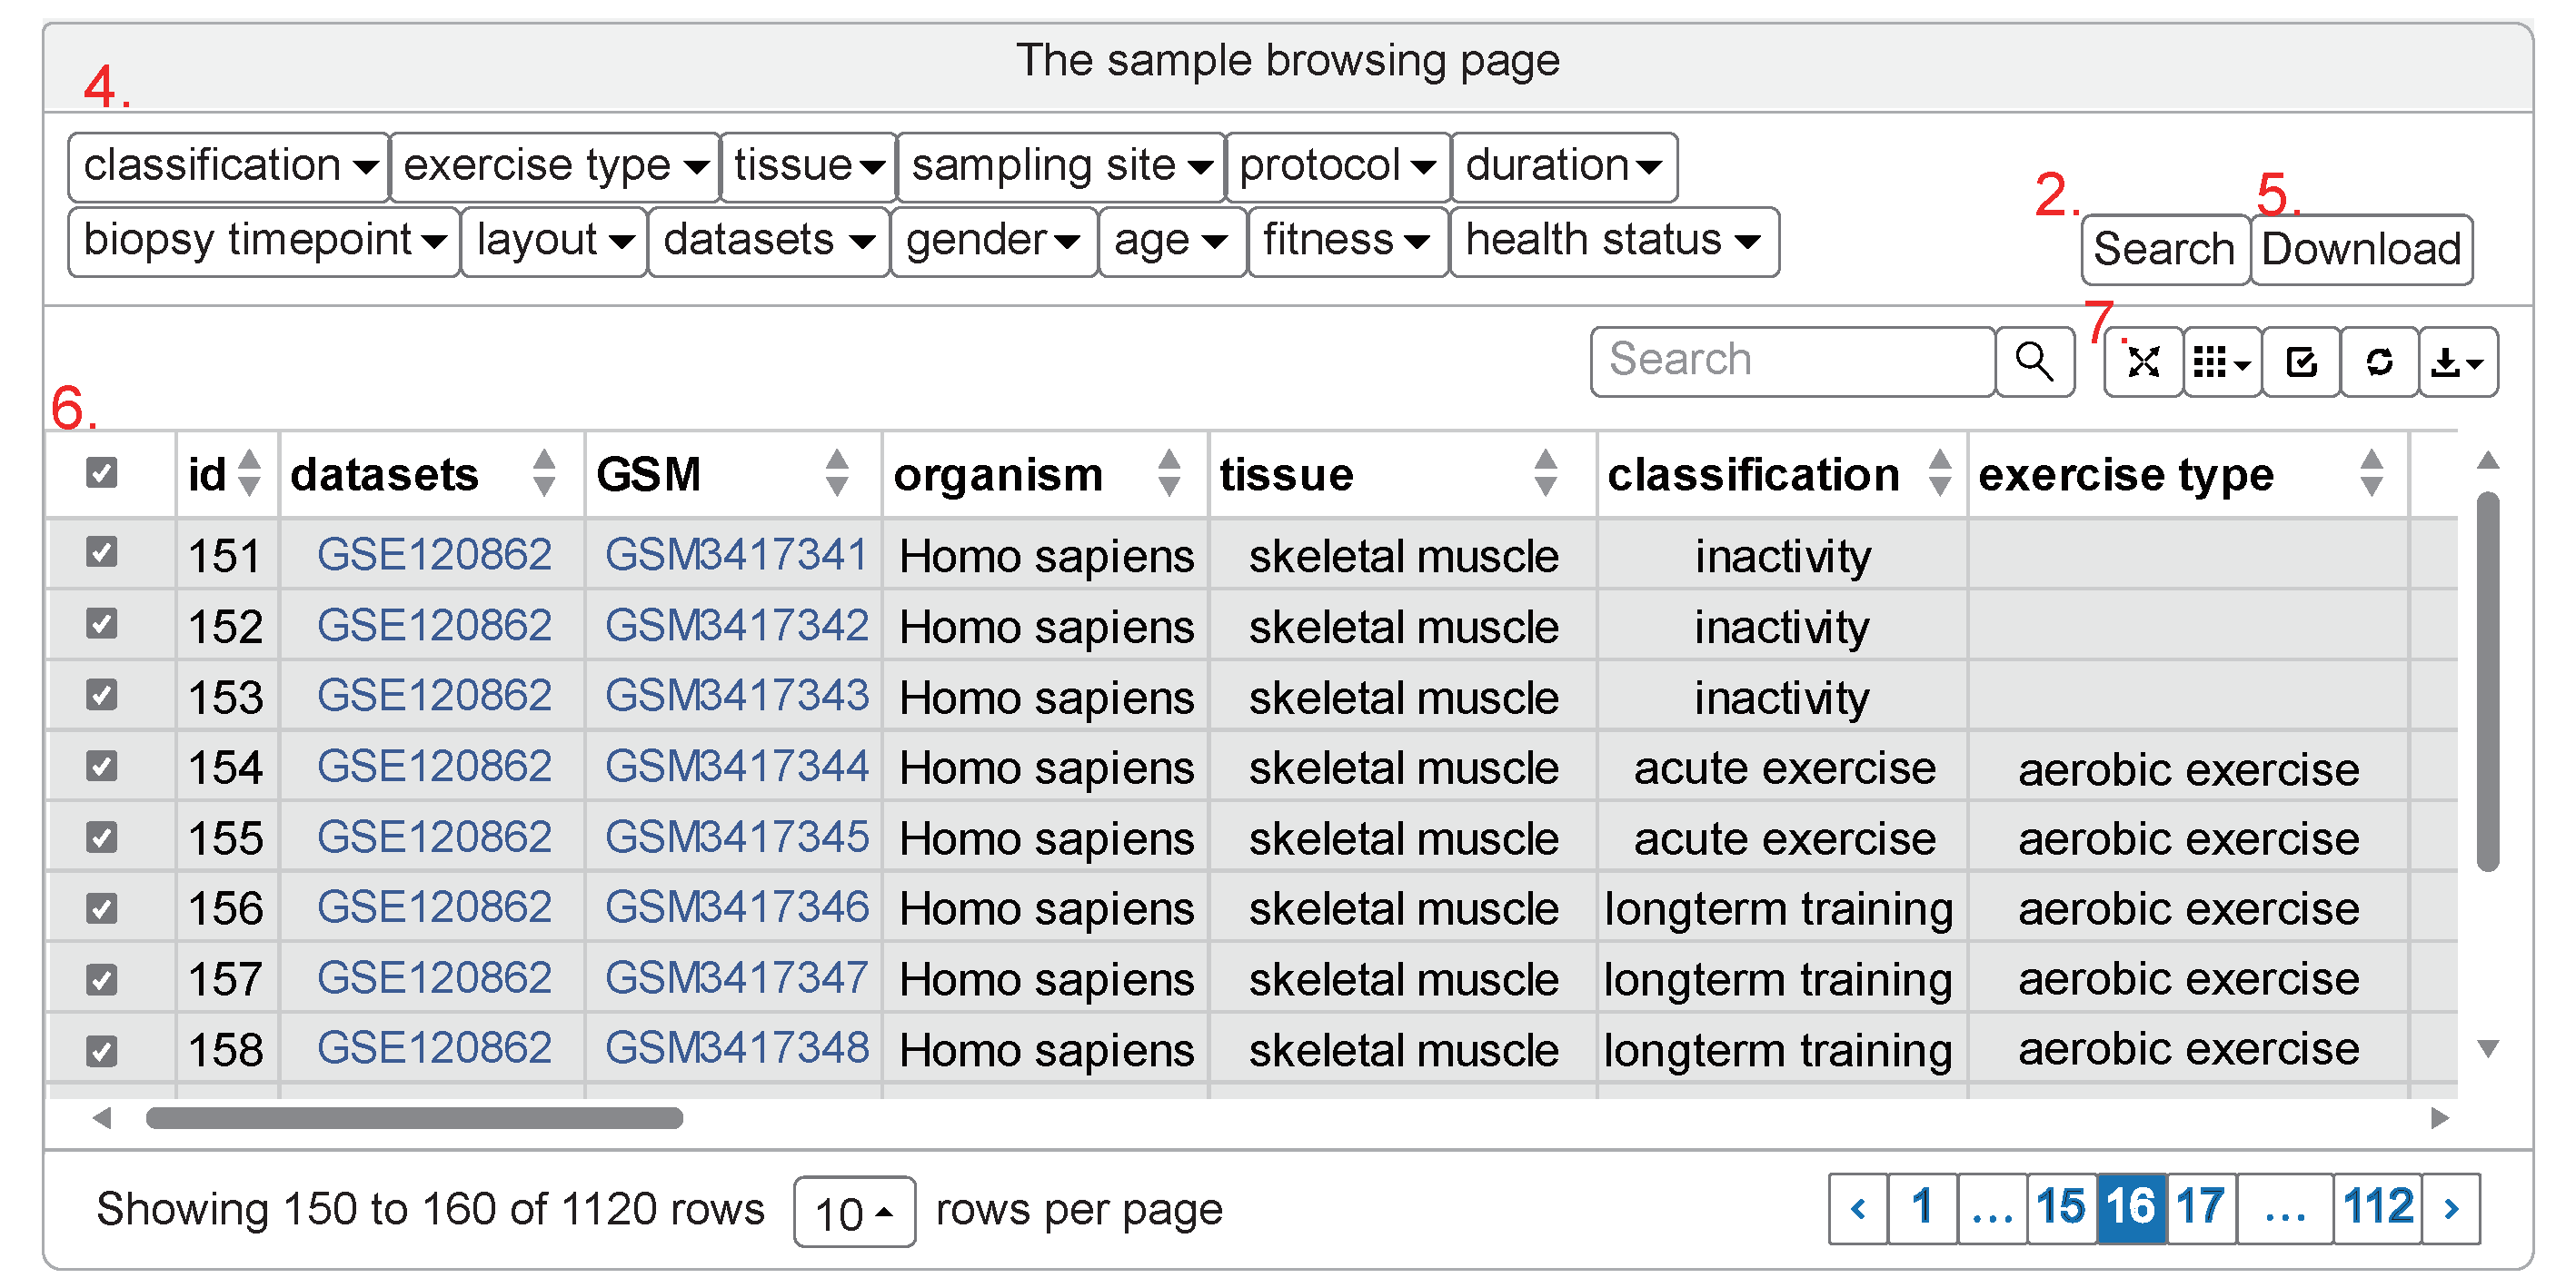
- filters for initial screening
- download the holistic sample metadata matrix as tab delimited text file
- select all or none in the expressed page
- From left to right:
- View the sample metadata matrix in the fullscreen format
- Choose the columns to express and customize the data exported
- select all or none in whole pages
- refresh the sample metadata to default mode
- export the customized data (without the unselected rows and columns)
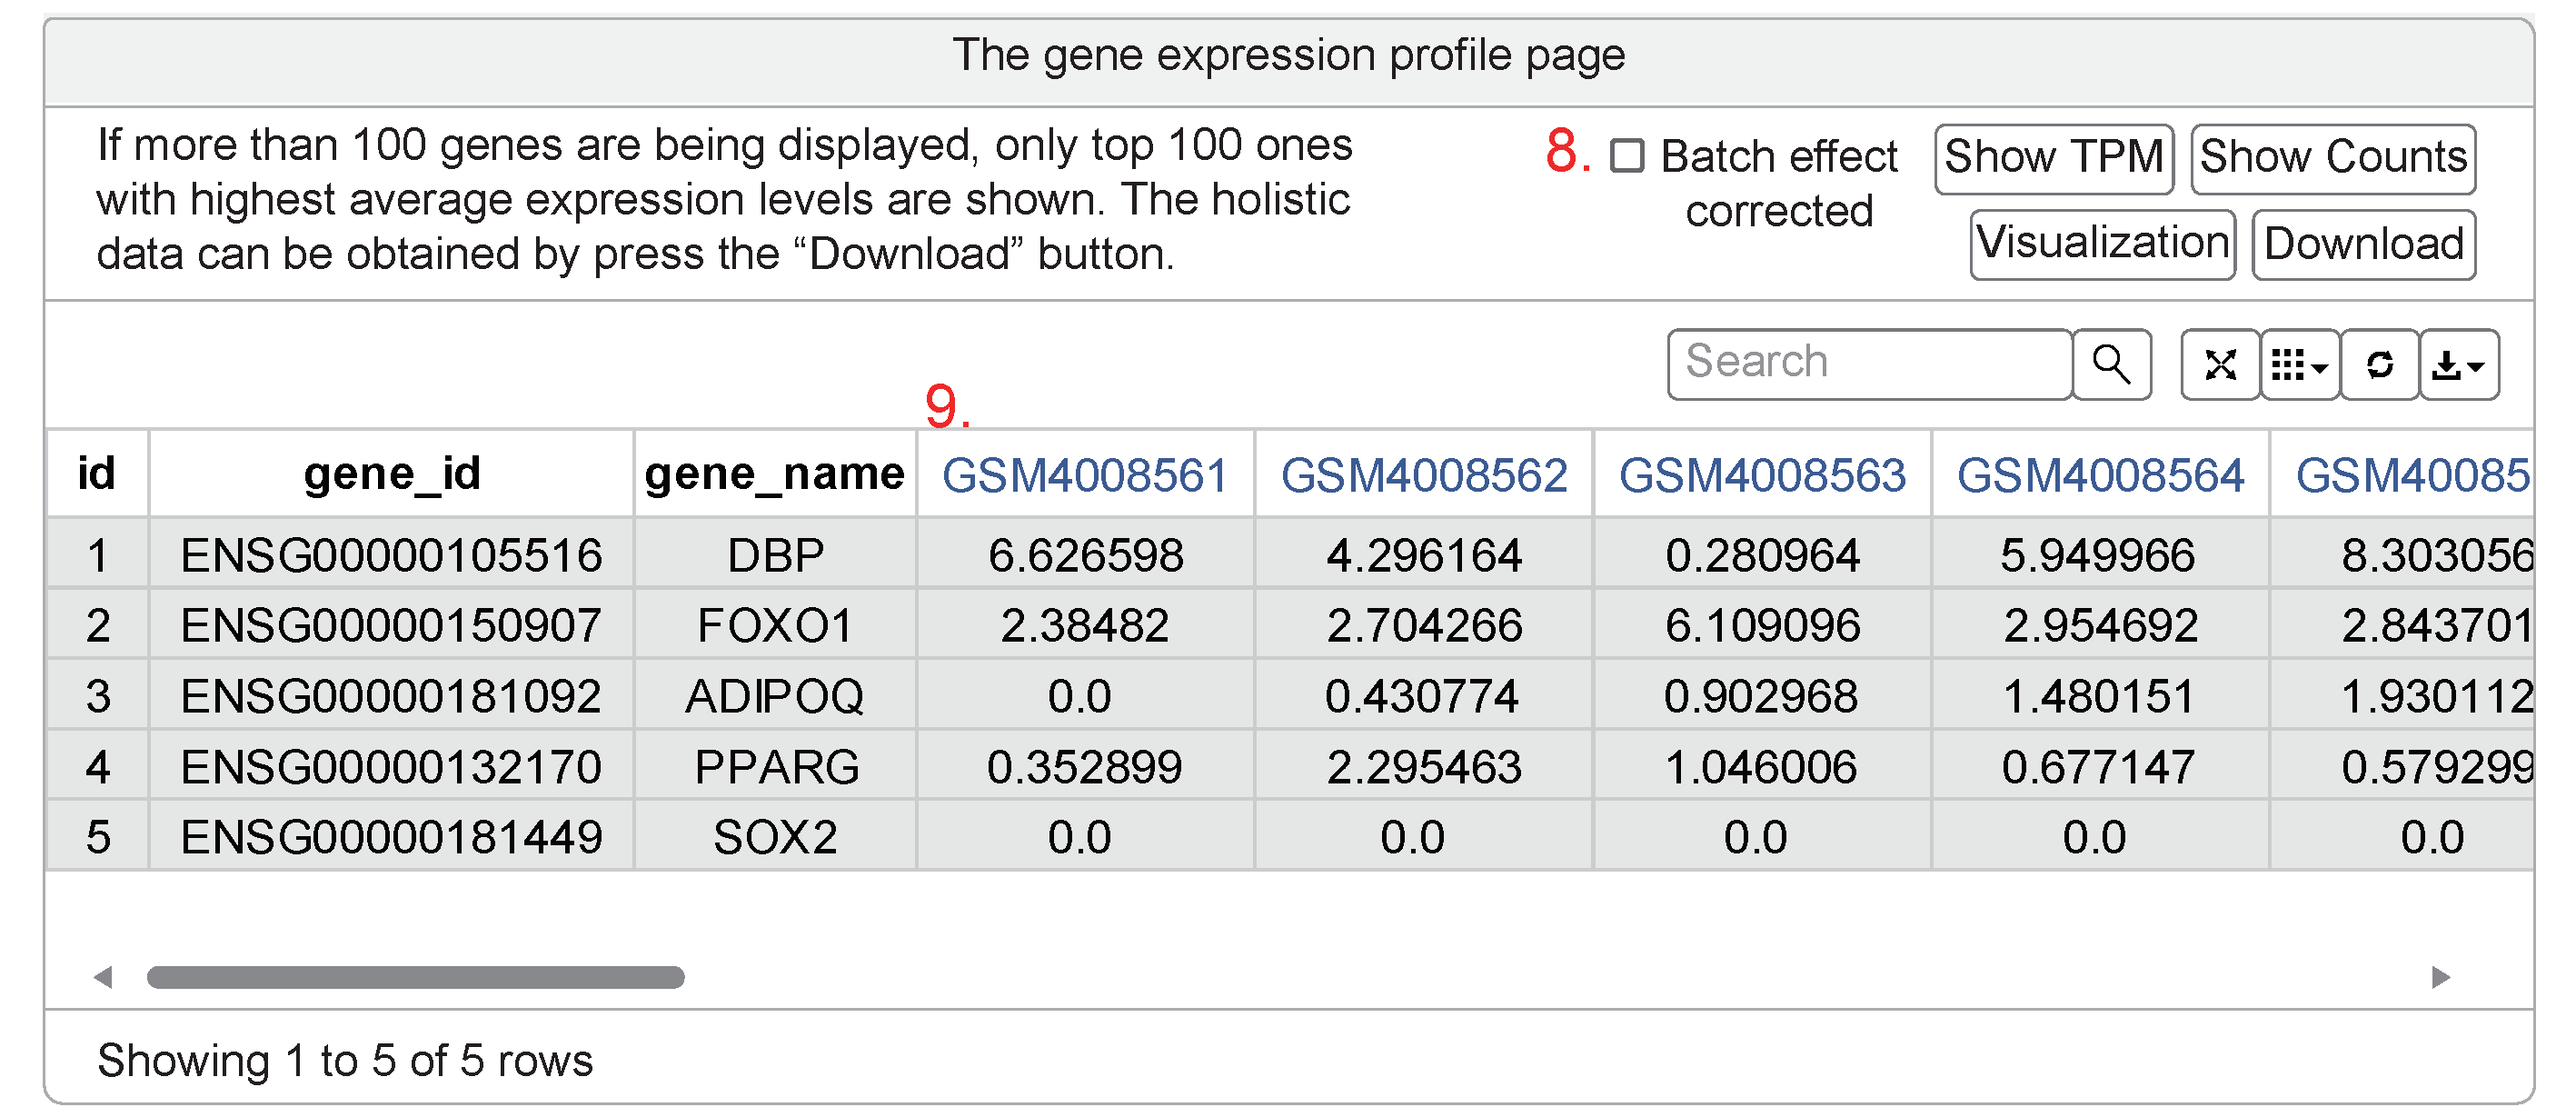
- The gene expression profile had been shown in the batch effect uncorrected form. The default option is a pre-computed batch effect corrected version of the expression levels taking the study as batch effect.
- The links back to the sample browsing page to display the specific dataset (beginning with the letter "GSE") containing the definite sample (beginning with the letter "GSM").
-
What’s the meaning of the legends used for the annotation of samples?
Category Attributes Content basic information organism The species information, recorded as “Homo sapiens” and “Mus musculus” datasets, GSM, SRR, SRX The “datasets” were accession numbers in GEO, and the remain were recording numbers of samples started with the corresponding letters. library preparation and sequencing extracted molecule It represents RNA enrichment strategy used in library construction, including mRNA enrichment with polyA tail (polyA RNA) and rRNA depletion (ribo-zero RNA). layout PAIED: pair-end sequencing
SINGLE: single-end sequencing
library prepared method NONE: non-strand-specific sequencing
F/R, FR/RF: strand-specific sequencing
For single-end sequencing, “F” confirms a library as “fr-secondstrand”, while “R” as “fr-firststrand”.
For pair-end sequencing, “FR” confirms a library as “fr-secondstrand”, while “RF” as “fr-firststrand”.
subject information platform ID, instrument model Samples with these types of information were filled in the attributes. health status, fitness The health status and physical activity level of the subjects before the experimental intervention.
The health status of the subject if clearly stated in the publication. For human, samples with “ME/CFS”, “morbid obesity” and “Parkinson's Disease” were obtained, Healthy samples accounted for 89.1%. The corresponding “health status” of mice is reflected by the mouse background and genotype.
Fitness was classified as sedentary, active, trained, untrained according to the annotation of subjects in the publication.
age For human, <35 years old defined as “young”, 35-60 years as “adult”, and >60 years as “aged”;
For mouse, before birth defined as “embryonic", 0-3 weeks defined as “neonatal”, 3-7 weeks as “young”, 2-12 months (8-48 weeks) as “adult”, and 13-24 months or longer lifecycle as “aged”.
gender, mus background, mus genotype The background of mouse roughly was C57BL/6, BALB/c, ICR and CD1. The genotype was varying. treatment The all procedures towards each sample were shown in this part, such as diet. exercise interventions classification Categorizes according to time.
Acute exercise: single non-repetitive movement (<3 times)
Long-term training: periodic exercise (≥3 times)
Inactivity: sedentary controls, as well as “bed rest” studies in human
exercise type Resistance exercise, aerobic exercise, combined exercise, high-intensity interval training frequency, intensity, duration For long-term training, “duration” just storages the total period of motion, and the time information of single session incorporated into “frequency”. protocol The detailed exercise method used in exacted sample, such as treadmill or voluntary wheel running, cycling or knee extensions. In samples with the protocol of unilateral knee extensions, we indicate whether the exercised leg or non-exercised leg the sample belongs to. sampling information tissue and sampling site For human, tissues contain skeletal muscle and blood. For mouse, tissues include skeletal muscle, brain, heart, liver, fat, spinal cord, tumor, placenta, and bone marrow. The detailed sampling sites such as vastus lateralis or gastrocnemius were also annotated. biopsy timepoint Its cleared time pre or post the intervention. For example, 1h after the exercise would be presented as “post(1h)". other information group The group information in the exacted dataset for more user kindly foundation of relevant samples. Two conditions occurred. 1) cross-sectional (exercise vs. sedentary); 2) within subjects (pre- vs. post-exercise)
It should be noted that the biopsies before and after the exercise almost derived from the same subjects in human studies, and collected from subjects randomly assigned to different processing groups in mouse datasets. So, there were subtle differences in the grouping strategy. For example, the groups of the human dataset GSE108643 were “lean exercise” and “Ov/Ob exercise”, characterized by containing both the pre and post biopsies in one single group. Nevertheless, these of mouse dataset GSE101239 were “Control 12w”, “VPA 12w”, and “VPA+Run 12w”.
Notes: We had annotated the samples as clearly as possible in the sample browsing page. However, if you still confused about any attribute, please check the information of each sample and study in GEO database through the external links.
-
How do I understand nonparametric ANOVA analysis and the boxplots?
The nonparametric ANOVA table shows mean ± SD of log2 (FPKM+1) on 100 genes with the highest average expression in all groups. The purpose of ANOVA, in which the dependent variable is log2 (FKPM+1) and the independent variable is the six groups, is to test whether the expression of this gene is significantly different between the groups (used the KW test). Only groups with data were analyzed. The download option can reserve the whole genes you had searched as a text file.
On the basis of the ANOVA table shown in the website, 10 genes with the lowest p-value were shaped into boxplots. The abscissa of the boxplot is for the six groups, and the ordinate is log2(FKPM+1). The boxplots hadn’t considered the elimination of outliers, and only provide preliminary visual analysis. The boxplot is mainly composed of 5 numeric points: minimum, lower quartile, median, upper quartile, and maximum.
Moreover, the data form TPM can also be used as input.
-
What is the version history of the database?
The version number is divided into three parts. The first part represents the update of the interface, which is upgraded when there is a major change. The second part represents the time range of included data, for example, "2212" in “V1.2212.A” represents that the deadline of data inclusion is December 2022. The third part represents an update of the existing version of data, such as adding a new metadata attribute.
GEPREP V1.2212.A - Initial release on January 1, 2024.
GEPREP V1.2212.B - Release on June 5, 2024.
-
What to do if I need more information?
Due to limited bandwidth, large intermediate data, such as the raw sequences, the aligned BAM files, the signal tracks and transcript level expression quantification results were not directly downloadable from the web site, but available on request. The contact authors were listed below:
Bingxiang Xu, bingxiang.xu@hotmail.com
Longhua Liu, liulonghua@sus.edu.cn